Last week, I took a closer look at outside days on a candlestick chart of the S&P 500 Index (SPX). As a refresher, an outside day occurs when a stock’s daily high is higher than the prior day’s high, and its low is lower than the prior day's low. Essentially, it engulfs the prior day's range. In that article, I broke down when outside days tend to be more meaningful instead of just noise. This week, I’m applying the same analysis to individual stocks within the S&P 500. By the end, I find a setup that stands out - one I’ll be scanning charts for going forward.
Drilling Down on Outside Days
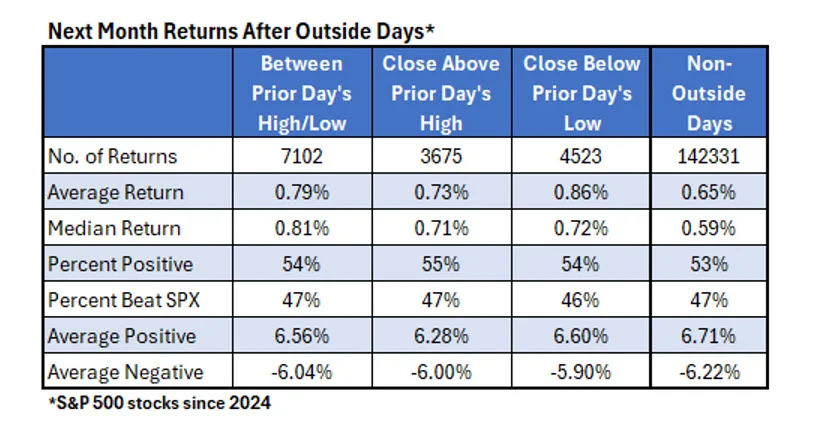
For the following analysis, I looked at S&P 500 stocks since the beginning of 2024. That returned 15,300 outside days total. The table below separates these outside days by where the stock closed on the outside day relative to the prior day’s high and low. If the stock was below the prior day's low then rallied to close above the prior day's high, it would suggest a lot of buying pressure (second column in the table below). On the other hand, if the stock was above the prior day’s high then closed below the prior day's low, it would suggest huge selling pressure (the third column in the table).
The last column in the table below shows non-outside days, which can be used as a benchmark. Stocks tended to be bullish after general outside days. Over the 15,300 outside days, they average about 0.80% over the next month, compared to 0.65% for non-outside days. The percentage of positive returns and the percentage of time they beat the SPX has been about the same for any column. There’s some evidence of mean reversion with the best average return (0.86%) occurring when the stock closes below the prior day’s low. As far as outside days go, the lowest average return is 0.73%, which is when the stock closes higher than yesterday’s high. Overall, however, there’s not a ton here that’s actionable, so let’s drill down further.
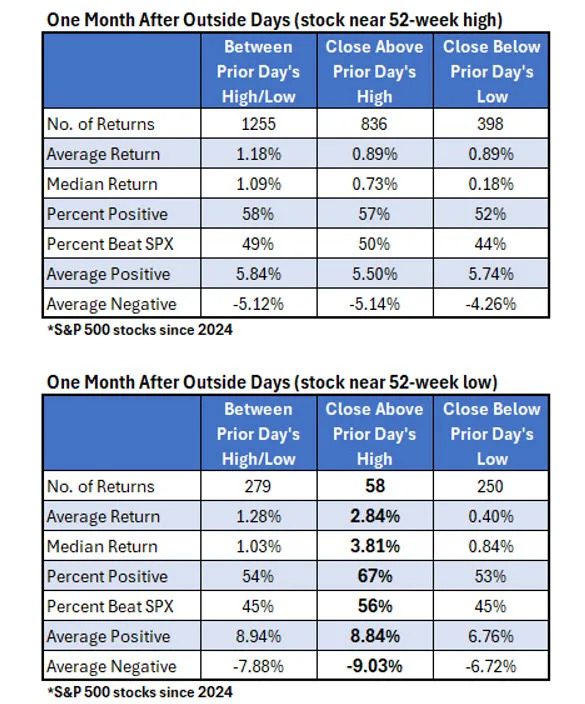
Outside days are often considered potential reversal points. With a stock at a high, the selling pressure needed for a bearish outside day suggests a decisive move by traders and a signal that things are changing, vice versa for stocks near a low. Therefore, I broke down the outside days further by whether the stock was near a 52-week high or 52-week low.
The first table considers stocks near a 52-week high and summarizes the performance after outside days, broken down by how the stock closed relative to the prior day’s high and low. In general, outside days on stocks near highs have been slightly bullish. After a bearish outside day (third column) with the stock near a high, the stock beats the SPX just 44% of the time, suggesting it is somewhat of a headwind. The 0.89% average return for the stock, however, means there’s not much of a case to avoid the stock.
In the second table below, I find a very compelling setup. For stocks near a 52-week low that experienced an outside day in which the stock closes above the prior day’s high (a bullish outside day), they averaged a return of 2.84% over the next month, with 67% of the returns positive and 56% of them beating the SPX. This suggests a very good indicator for finding a reversal point in a beaten down stock.
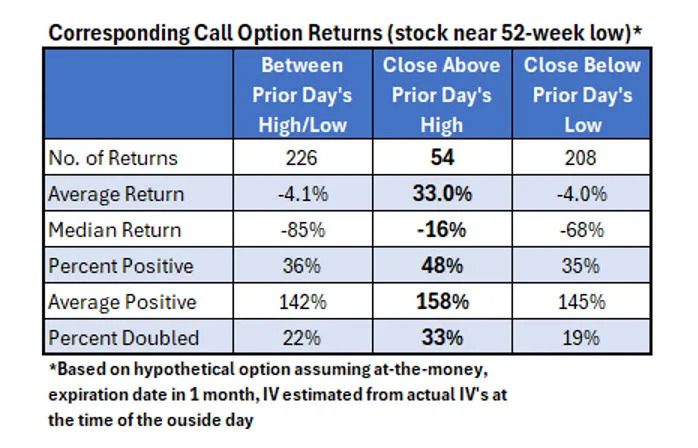
A fun ‘what if’ game is to see what kind of returns you could have gotten on these setups if you played call options instead of buying the stock. Since we specialize in options at Schaeffers, it’s a little more than a ‘what if’ game for us. The table below summarizes how call options would have performed on outside days with stocks near a 52-week low. These are gathered by assuming hypothetical options that are at-the-money, expiring in exactly one month, and closed on expiration day at intrinsic value.
The implied volatility (IV) is calculated using actual IV’s for the stock on the day of the signal. (Note there are slightly fewer returns in the table below, because some stocks had option prices that were too wide to get a decent IV estimate). Buying call options on those bullish outside days with a stock near a 52-week low would have yielded 33% return per trade. A third of the call option trades would have seen a double (100%+ return).
Since 2024, buying call options on stocks near a 52-week low after a bullish outside day has been a very bullish strategy. I will scan for these setups going forward and hopefully the trend continues. For those curious, there have been three signals over the past couple of weeks. PepsiCo Inc (NASDAQ:PEP) and Campbell's (NASDAQ:CPB) signaled on Monday this week, and Biogen Inc (NASDAQ:BIIB) signaled last Thursday. The analysis above suggests these stocks might be ripe for a turnaround.